
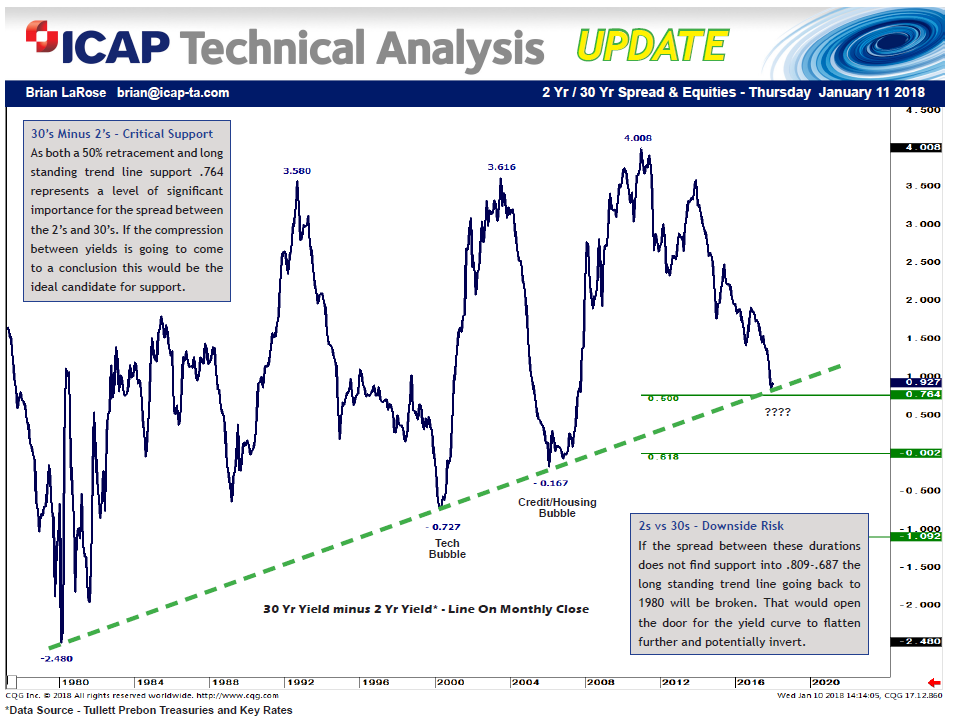
The Last two equity bubbles burst when the spread between the 2 Yr US Treasury Yield and the 30 Yr US Treasury Yield inverted. While this spread has not inverted, it is testing key trend line support associated with the bursting of the Tech Bubble and the bursting of the Credit/Housing Bubble. Suspect this spread will need to crack .764 to keep the melt up in equities going. Otherwise, equities could be in real trouble.
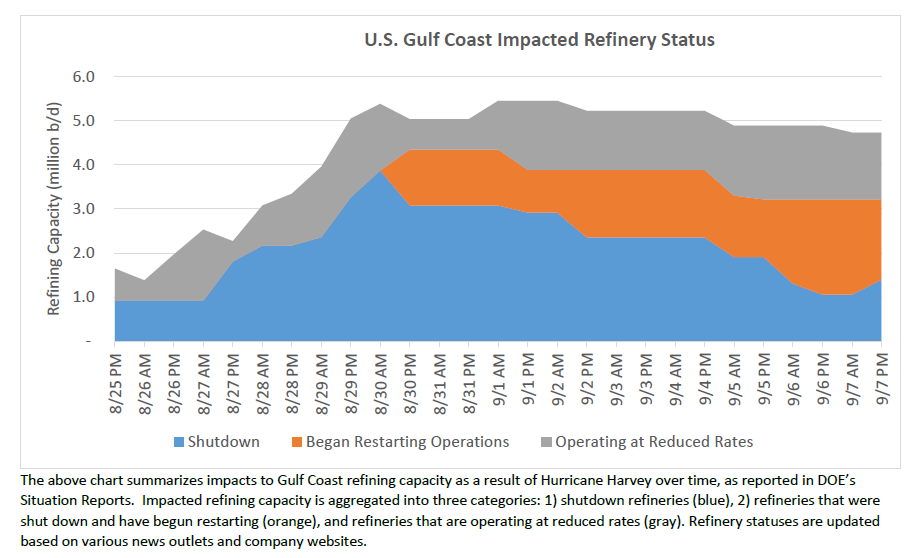
As of 02:00 PM EDT, September 7, six refineries in the Gulf Coast region were shut down, according to public reports. One refinery that previously began restarting has shut down due to electrical issues since the last report. These refineries have a combined refining capacity of 1,395,000 b/d, equal to 14.4% of total Gulf Coast (PADD 3) refining capacity and 7.5% of total U.S. refining capacity.
Five refineries are in the process of restarting after being shut down. This process may take several days or weeks to start producing product, depending whether any damage is found during restart. Production should be assumed to be minimal until restart is completed. These refineries have a combined capacity 1,819,199 b/d, equal to 18.8% of total Gulf Coast (PADD 3) refining capacity and 9.8% of total U.S. refining capacity.
At least six refineries in the Gulf Coast region were operating at reduced rates, according to public reports. These refineries have a combined total capacity of 1,513,776 b/d, equal to 15.6%of total Gulf Coast (PADD 3) refining capacity and 8.2% of total U.S. refining capacity. (NOTE: Actual crude throughput (production) reductions are lower than the total combined capacity). No refineries that were operating at reduced rates began operating at normal rates since the last report.
Full Report Here…
https://energy.gov/sites/prod/files/2017/09/f36/Hurricane%20Harvey%20Event%20Summary%2022.pdf
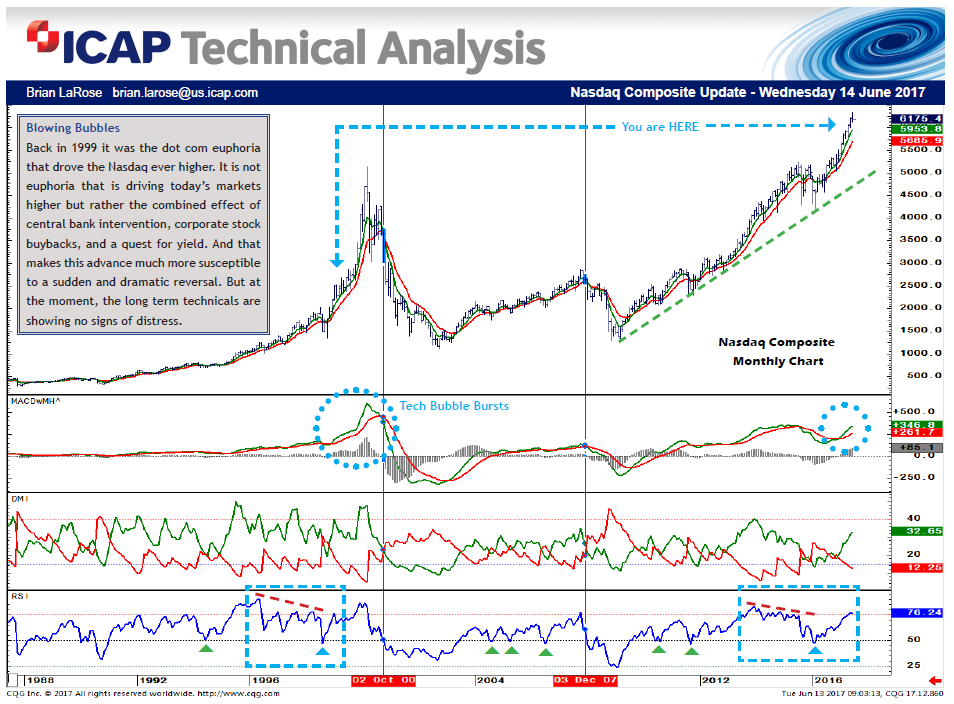
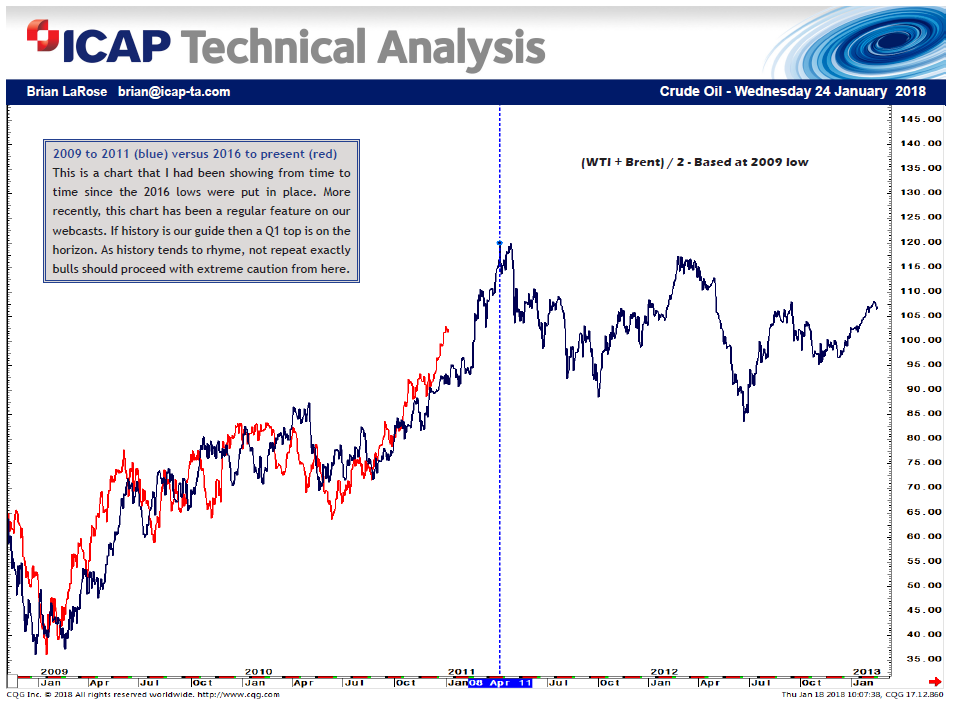
As the late Prince so famously said, life is like a party and parties weren’t meant to last. Make no mistake, this party will come to an end. The only question is when? During the Tech Bubble it took more than two years for the Nasdaq to carve out a technical top. In 2007 the reversal was immediate and relentless. We have already concluded that the current price action has more in common with the price action during the period between mid 1998 and late 2000. But history does not repeat exactly. It does however, rhyme. The problem we are facing, with central bank intervention distorting the markets it is hard to determine just how much the easy credit bubble could inflate. While we do not have a crystal ball [unless a magic 8 ball counts] to tell us exactly when a top will form we do have a technical blueprint that we can follow, that of the Tech Bubble. For now, the party appears to still be going strong, but our word of advice, do not overstay your welcome.
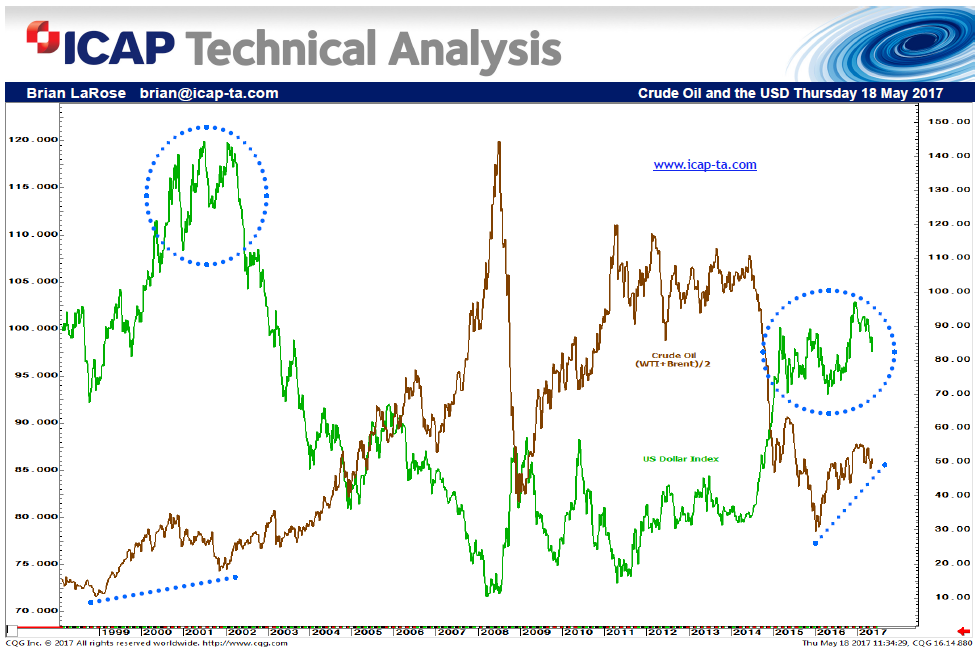
While all eyes have been focused on OPEC, the US Dollar Index has made a stealthy turn lower with very little fanfare. Should the decline in the US Dollar Index start to gain traction, oil prices (and commodities in general) could be the big beneficiaries. Such an event would be quite fortuitous for both OPEC and North American shale producers. …On the other hand, a sudden resurgence in the US Dollar Index could very well send energy prices crashing, which could be quite devastating for both OPEC and North American shale producers.
…Beware the US Dollar.
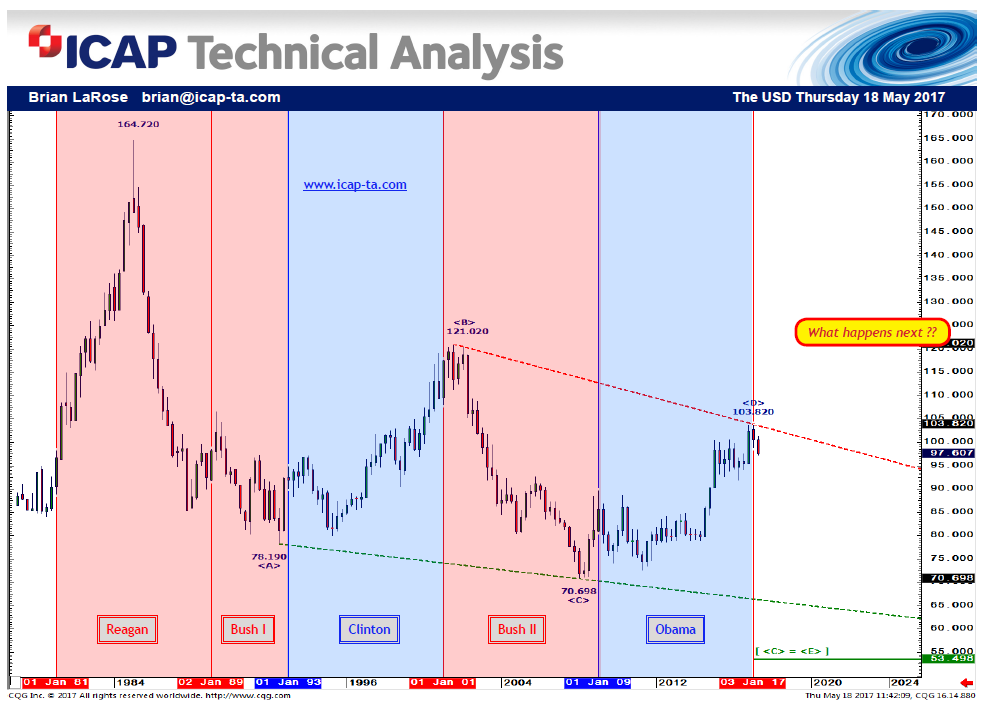
For those that may have forgotten, here is what the US Dollar Index has done since the Reagan Administration. If history is to be our guide we know what happens next…
Needed the S&P to hold 2226.50 to keep the up trend alive. The election night low, 2228.50. For the moment the trend is still up. But we will be watching intently to see what happens when the S&P reaches the upper limits of the broadening top pattern.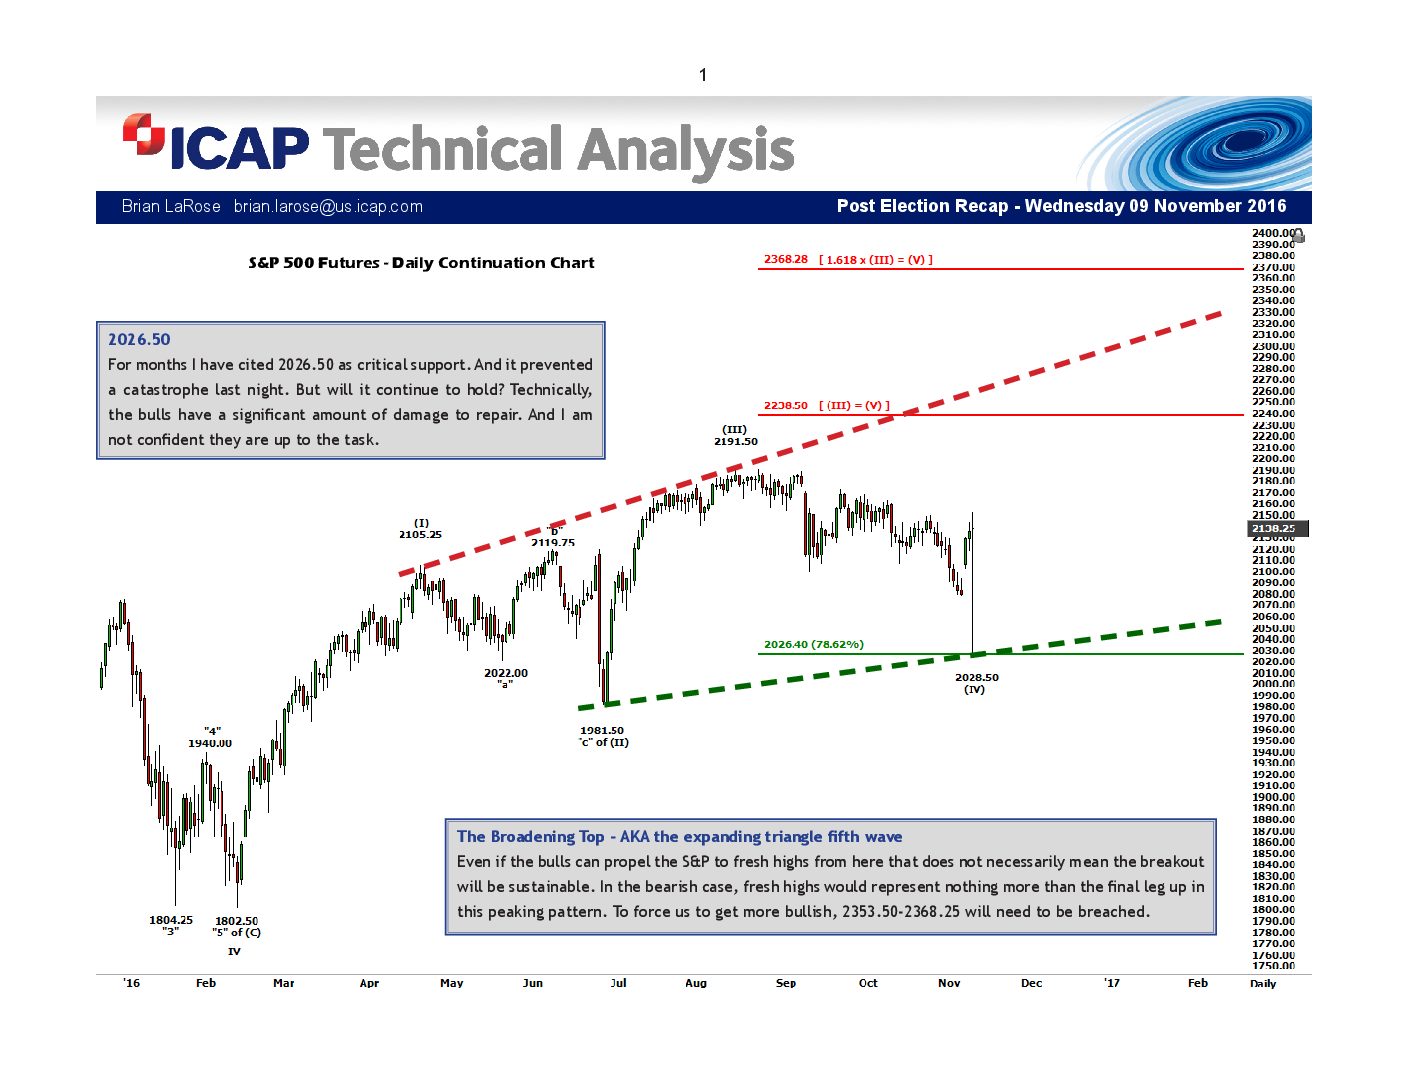
Is a major bear trap brewing in Copper? Have a text book zig-zag pattern off the 2.3235 high. If this count is correct Copper has the potential to better the 2.3235 high in the coming days. To set the stage for such a rally bulls will need to carve out a bottom in front of the 1.9355 low. Bears on the other hand need to take out 1.9355 to void this pattern and revive the prevailing down trend.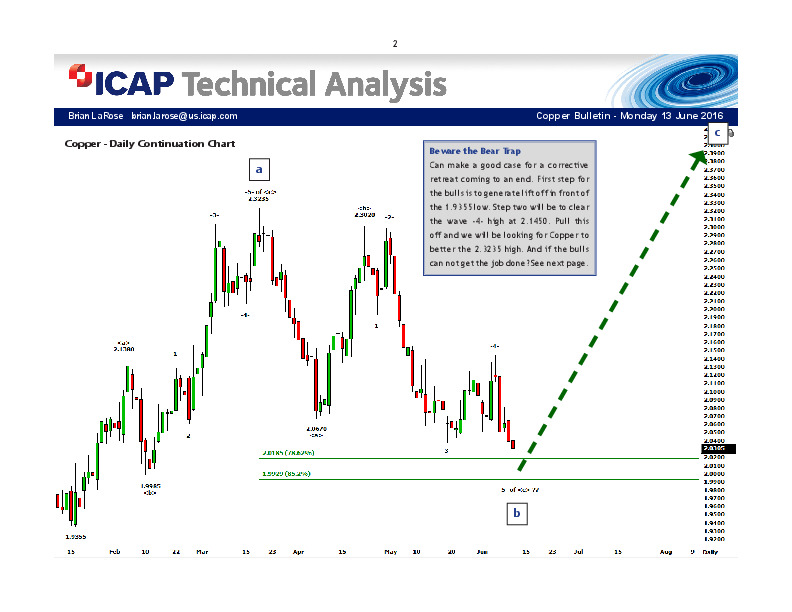
Have a text book ABC pattern down from the 2134.00 high along with a text book five wave decline off the 2110.25 high. The perfect set up for a bear trap. All that is needed to complete this pattern is a marginally lower low. Bears are on notice.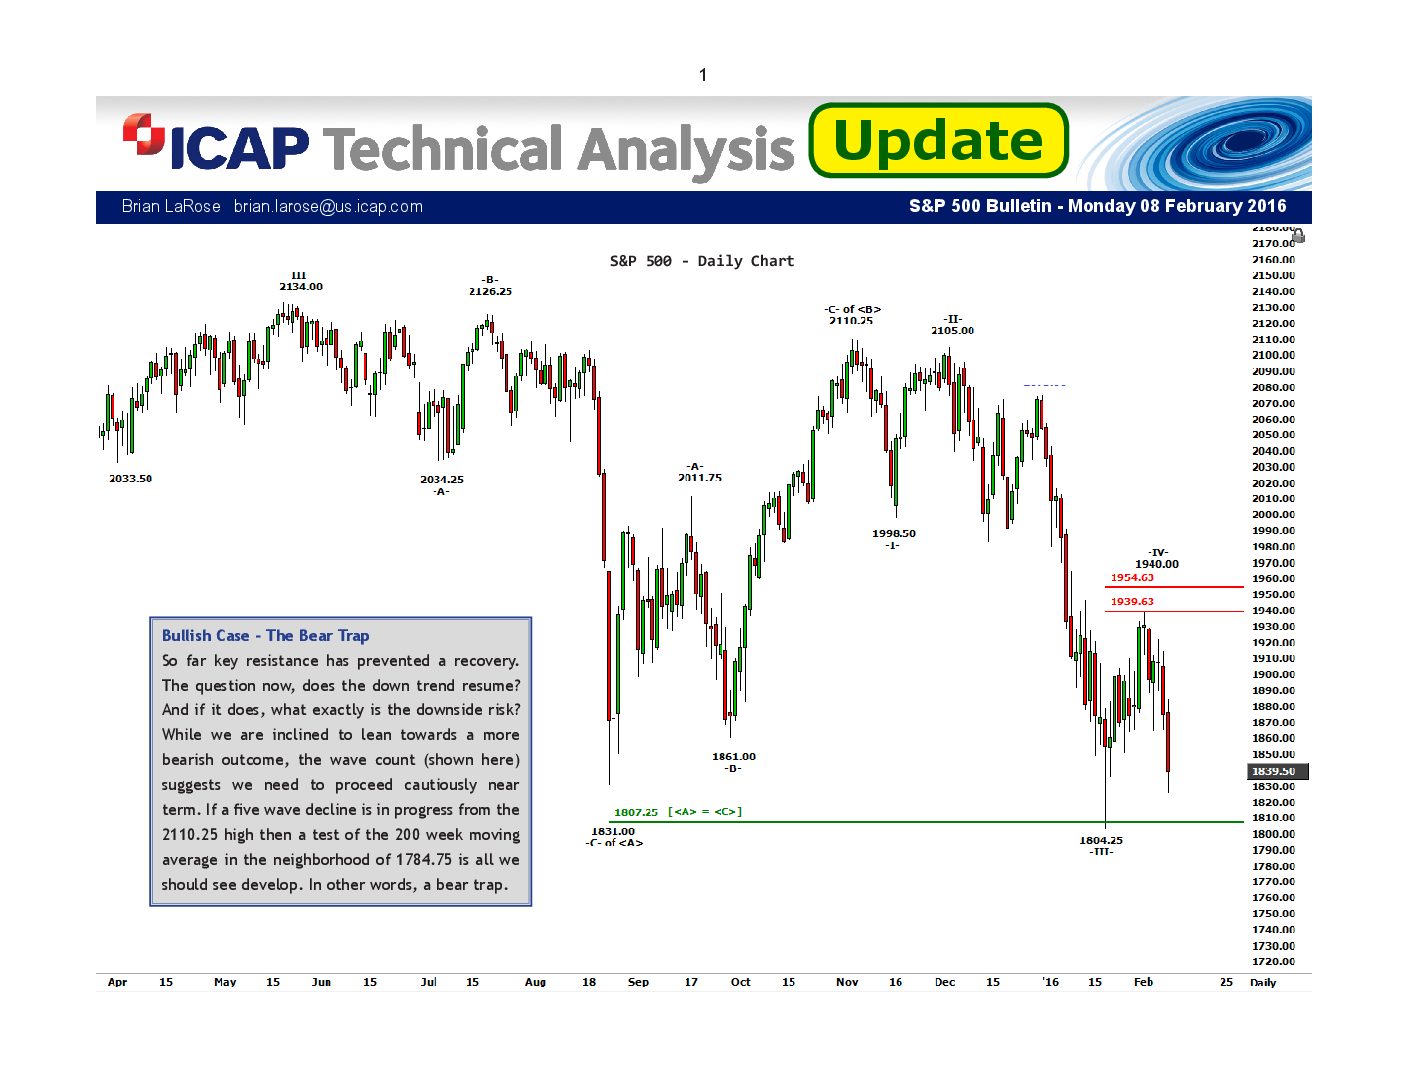
The economic or market commentary contained in this presentation is based on information that ICAP Technical Analysis, a division of ICAP Corporates, LLC (“ICAP”) believes to be reliable, but has not been audited or verified by ICAP for accuracy or completeness. This commentary is provided to you for informational and educational purposes only, and is subject to change without notice. Principals and employees of ICAP and its affiliates may trade, for themselves, for ICAP or for customers, in the financial instruments or financial markets discussed in this presentation, taking positions similar to, or opposite to, the positions or market movements discussed in the presentation. Nothing in this presentation is intended to constitute a trade recommendation. The recipient of this presentation should take into account the recipient’s individual objectives, financial resources and needs in deciding whether to use any of the information in the commentary. Futures, options and other derivatives trading involves substantial risk and is not suitable for all persons.
By viewing this information you are agreeing to the ICAP-Technical Analysis Terms of Service.