
The Most Important Chart for Equities ??
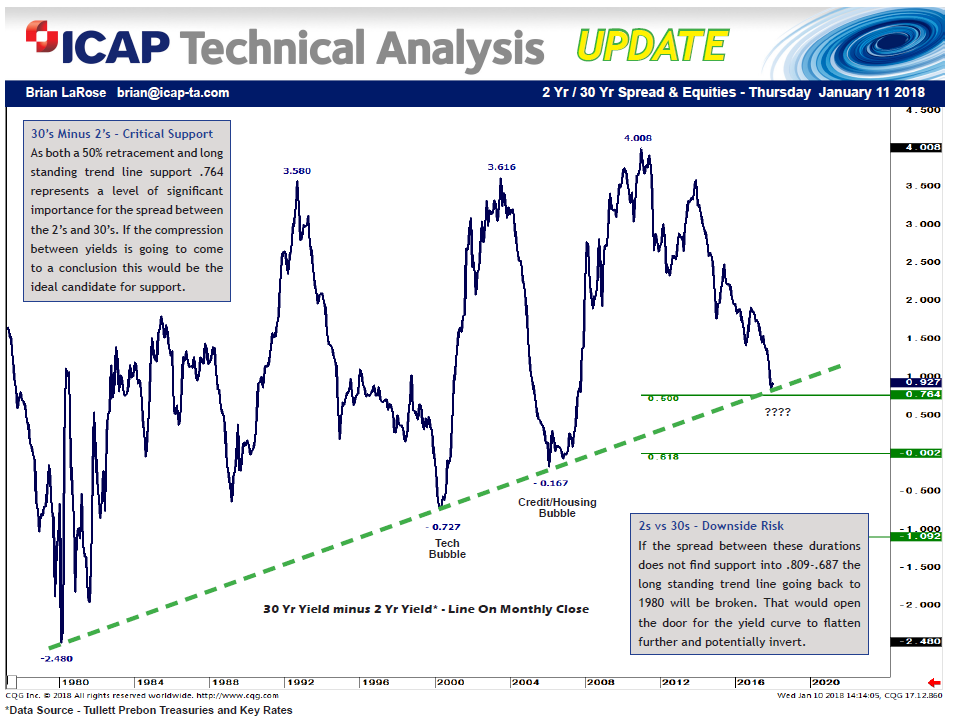
The Last two equity bubbles burst when the spread between the 2 Yr US Treasury Yield and the 30 Yr US Treasury Yield inverted. While this spread has not inverted, it is testing key trend line support associated with the bursting of the Tech Bubble and the bursting of the Credit/Housing Bubble. Suspect this spread will need to crack .764 to keep the melt up in equities going. Otherwise, equities could be in real trouble.